TL;DR
- Brand performance offers early signals of business growth, giving marketing leaders time to redirect their strategies before it’s reflected within sales figures
- Industry benchmarking adds context to those signals, showing whether your brand is gaining ground, losing momentum or moving with the wider market
- A reliable framework is built on three elements: a stable competitor set, focused metrics and a decision-led cadence
Fashion, Lifestyle and Beauty (FLB) brands have become increasingly sophisticated at measuring and reporting their own marketing activities. Yet marketing leaders still struggle to answer a wider question: how does their brand compare to its competitors and where do they sit in the wider industry? This is where industry benchmarking comes in.
43% of C-Suite executives want a clear, simple story on their brand health and business performance. (Gartner)
The issue is rarely a lack of data. It’s having a complete view of brand performance, and the market context needed to understand whether that performance is gaining ground, losing visibility or holding steady.
Answering that question takes more than a one-off competitor report. It requires a clear competitive set, a consistent metric to track visibility and impact, and a recurring cadence that turns these insights into decisions. In this article, we explore the practical framework FLB marketing leaders need to make industry benchmarking a repeatable and valued practice.
Why Industry Benchmarking is Essential for FLB Marketing Leaders
Competition is intensifying as the market gets more crowded and the boundaries are beginning to blur. New entrants are crowding established categories while existing players are expanding into adjacent ones: sportswear brands are moving into wider lifestyle spaces, beauty brands are stretching across categories and fashion brands are shifting their positioning. As a result, more businesses are competing for the greater audiences, cultural moments and market share.
Reporting on KPIs internally provides great insight into whether targets were met, which marketing and PR activities generated the most impact and how visibility may have changed over time. The problem is that these insights only stop at a brand’s own walls. When viewed in isolation, it doesn’t show whether your brand gained ground, which competitors outperformed your brand or where its position sits within the wider industry.
A 15% increase in a KPI can look strong in isolation. But if your competitors grew 30%, it indicates your brand may be losing ground. Equally, a flat result can be disappointing—until data shows a decline for the rest of the market, while your brand holds steady. Both figures tell a different story once market movement is factored in.
This is the distinction leadership is increasingly looking to understand. To fill this gap, some brands commission third-party reporting. While these provide a snapshot of how your brand is performing, they are restricted within a time window that expires when the market continues to move. Repeating this can be costly and by the time leadership receives these insights, the campaigns, competitors and market dynamics behind it may have already shifted.
Sales data however, come with different limitations. While essential, these confirm what already happened. On the other hand, brand performance can reveal earlier signs of changing momentum while there is still time to respond. While it does not replace commercial performance, it can help marketing leaders understand what may be forming ahead of it and where strategy may need to adapt.
The real value of industry benchmarking is having a current, repeatable view of your market position that can sit alongside sales, campaigns and brand performance when decisions are being made. This requires a more structured, ongoing practice with consistent measurement. Here’s how to build that process.
What Industry Benchmarking Analysis Should Look Like
For an accurate and reliable analysis, every brand should be measured under the same conditions: competitor sets, markets, time period, channels and measurement standard. Changing any of these mid-comparison will make it difficult to tell whether a shift reflects real market movement or just a different basis for comparison. Done properly, the analysis should be able to answer three things without ambiguity: where you stand, what changed and what drove it.
This requires a centralized brand performance platform that brings together brand and competitor data under one consistent measurement standard.
Industry Benchmarking Software
While there are various generalist solutions that support industry analysis, these solutions often require time and effort to reconcile data from different platforms and interpret metrics, which may not translate cleanly across channels. As a result, it makes industry benchmarking analysis a much more complex, lengthy and manual process than it needs to be.
Having recognized the fragmented and manual ways marketing and PR professionals have been measuring their brand performance, Launchmetrics developed a Brand Performance Cloud that unifies media monitoring and competitor benchmarking. It developed an AI-powered algorithm built on a foundation of 20+ years of historical data on FLB brands, to create one consistent standard for evaluating and comparing brand impact.
Media Impact Value® (MIV®) is a proprietary metric that assigns a monetary value to each placement across channels, regions and Voices—Celebrities, Traditional Media, Influencers, Partners and Owned Media. It intelligently weighs different factors such as source authority, content quality, engagement and more to accurately add a dollar value that puts all placements on a level playing field for easy comparison—something almost impossible to do because of channel nuances.
This makes it easy for marketing and PR teams to understand the impact of their marketing and PR activities, where that impact comes from, and how it compares to the market.
Data Visualization Enables Consistent Industry Benchmarking Analysis
If every review requires a manual rebuild, teams spend more time preparing the analysis than acting on it. A centralized dashboard gives the team one place to track brand and competitor performance.
Launchmetrics’ dashboards build on the foundation of MIV to provide deeper insights into brand performance at a glance. This enables marketing and PR teams at any level to understand their competitive position, while revisiting and adjusting when needed. Below are some of the key insights brands can quickly draw from its dashboards.
Key Insights
- Industry Overview Rankings: Ranks each brand in its competitive set by MIV, with insights into how each brand’s ranking has evolved over the selected period, region or channel
- Share of Value: Percentage of the conversation your brand owns within the total competitive set’s MIV and placement
- MIV and Placement Evolution: Tracks both metrics over time by brand
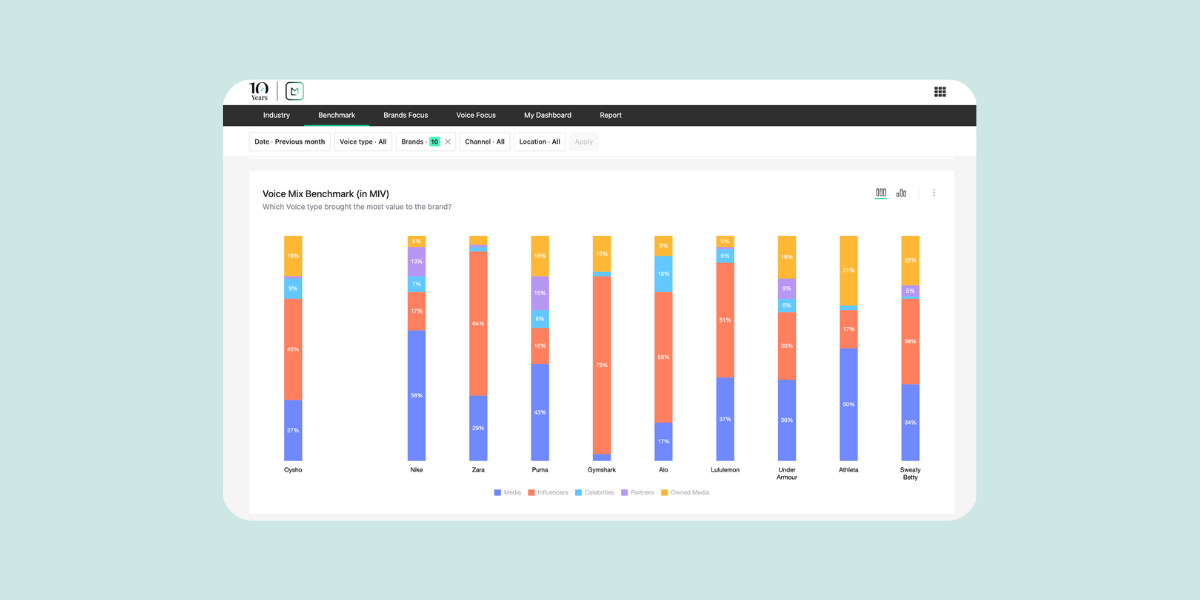
- Voice Mix Benchmark: Performance by Voice type for each competitor, showing the strategies and sources driving brand performance
- Channel Mix Benchmark: Performance by channel type for each competitor, uncovering the channels driving brand performance
How to Do Industry Benchmarking: Building a Cadence Your Team Can Own
A reliable and user-friendly platform at hand means moving onto the next step: building a framework around it. By establishing the market context, you can fix the variables to make each review comparable and actionable. Let’s see how this is done below.
Step 1: Start with the wider industry
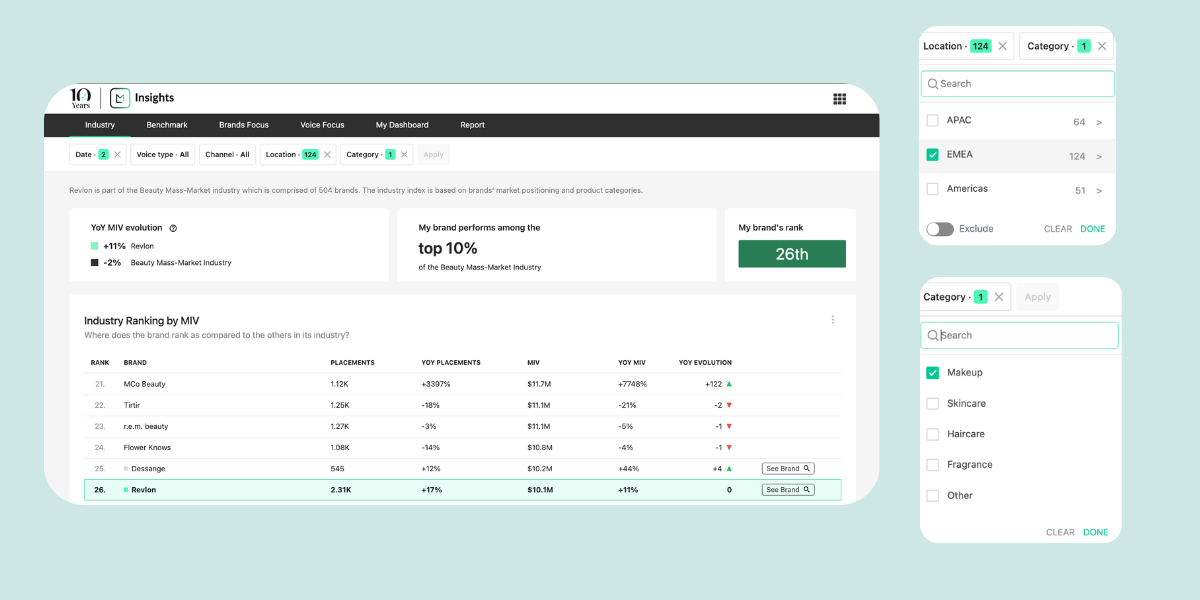
Before locking in your competitor set, start by seeing where you stand against the wider industry. Launchmetrics’ Industry dashboard shows your brand’s position against the other players in your segment, including newcomers and unexpected performers that may sit outside the usual bracket.
The wider view helps you to understand where the market is moving before narrowing the analysis. Brands can identify who is dominating the conversations within your industry, making it easy to revisit and check for quick updates between reporting cycles as part of an ongoing measurement process.
It’s crucial to make the most out of your filters to narrow down the context needed for your industry benchmarking analysis. For example, beauty brands competing between make up, skincare, hair care and fragrance categories may want to see where they sit within a particular category. As an example, we looked through the lens of Revlon in the make up category within Europe in S1 2026 in the snapshot below.
Step 2: Fix the competitor set
Once you’ve scanned the wider industry, the next step is sharpening that view down to the competitors that matter the most to the business. These can be brands that compete for the same audiences, territories or price positions. Launchmetrics’ Benchmarking dashboard enables users to select up to 10 competitors to benchmark, along with other key filters, to populate each chart, table and graph within the platform.
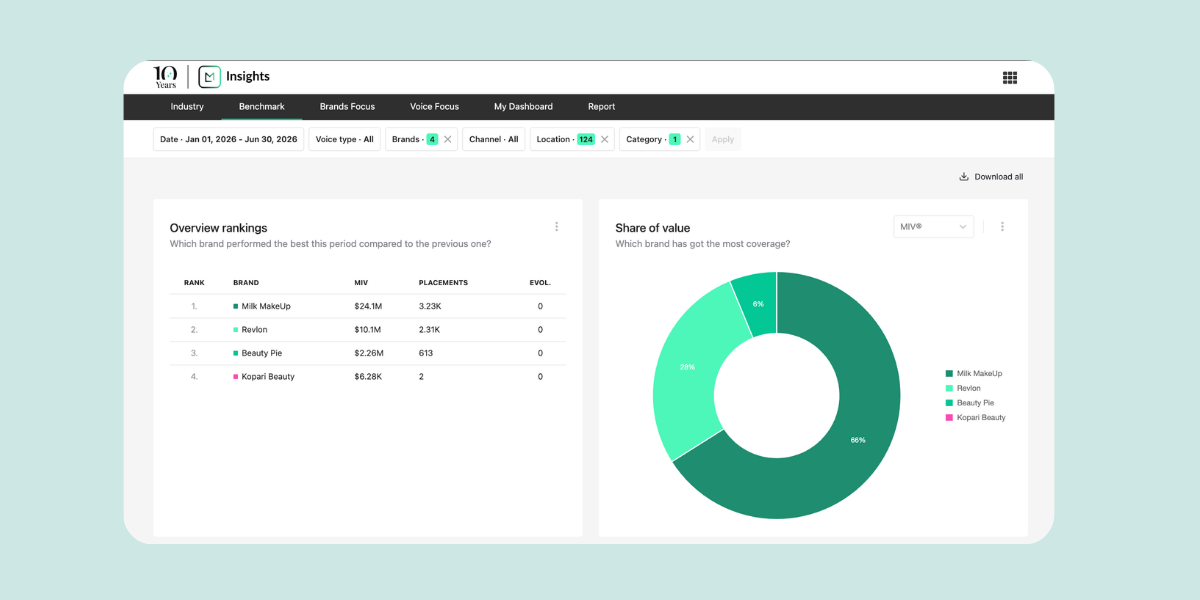
Ideally, marketing leaders should try to stick to the same competitors within an agreed time period to ensure their analysis is comparable over time. That said, the market can evolve with major shifts such as competitors being acquired, a new dominant entrant or even a category redefinition, justifying a revisit. When making these changes, be sure to document changes to the set and the reasons behind it, so comparability isn’t lost but rather intentionally reset on a baseline.
From a wider lens of where the industry is heading to a stable, precise view of your competitors that matter most on a regular basis, the next step is uncovering the strategies behind each brand’s market position.
Step 3: Analyze key metrics
While MIV indicates whether brand performance is moving up or down, it’s worth understanding why. Launchmetrics enables users to go deeper into the strategies behind that performance, breaking a single KPI down into the specific levers driving it. This turns a ranking into something a marketing leader can actually act on.
There are five metrics in the benchmarking dashboard that enable easy comparison:
- Share of Value
- MIV evolution
- Channel Mix
- Voice Mix
- Brand efficiency
Each factor calls for a different response, and it requires insight-led decision making fueled by industry benchmarking. These metrics make it easy to report on, tracing whether it’s a shift in the Share of Value came from your brand’s own growth, or a dip in MIV back to a Voice or channel type.
Step 4: Set a Decision-Led Cadence
With a dashboard in place, it becomes routine to check your brand performance on a daily or weekly basis. Rather than producing in-depth reports, teams should be able to identify material movements as indicators as it happens. If a competitor’s positioning improves drastically following a product launch, its Share of Value increases and its Influencer MIV has suddenly soared, this should trigger investigation.
The more substantial analysis should sit within the business’ existing performance review cycles. Monthly reviews should build on this, connecting a brand’s own movement with business performance. Looking at benchmarking alongside campaign activity, regional priorities and sales performance can help leaders distinguish a temporary spike from a shift that perhaps requires action.
On a quarterly basis, this is where marketing leaders can delve into the patterns that have happened over time. Big decisions are often made here, whether that’s a budget allocation, channel investment, Voice strategy or even scaling an approach.
This cadence works because each layer serves a different purpose: daily and weekly monitoring catches what happens now, monthly reviews connect it to business performance and quarterly reviews determine where the business needs to focus next.
Launchmetrics’ dashboard and reporting capabilities make it easy for brands to export their analysis in Excel and PowerPoint presentations all within seconds.
Turn Your Industry Benchmarking Analysis into A Leadership Narrative
Industry benchmarking becomes valuable when it is built into a stronger account of brand performance. As FLB marketing leaders today are under pressure to show the value and outcomes of their efforts, industry and competitor benchmarking tie activations to business impact. This analysis is built on a clear account of what changed, why it matters and what needs to happen next. A useful executive update should be built on these four questions:
- Position: Where does the brand stand within the competitive set?
- Movement: Has that position changed beyond its normal range?
- Cause: Was the movement driven by the brand, a competitor or wider market?
- Decision: What action should the business take–or not take?
If you’re looking for an easy way to report on your industry benchmarking, our benchmarking template makes it easy to record, present and share your analysis.

Get the FLB Industry & Competitor Benchmarking Template
Our easy-to-use template makes it easy to report on your performance.
Frequently Asked Questions (FAQs) on Industry Benchmarking
When using a platform like Launchmetrics, daily and weekly monitoring can be just as simple as a glance at a dashboard. For more in-depth or granular reporting, most FLB brands practice this on a monthly, quarterly and annual basis. Each cadence builds on the last, which is why it’s essential to continuously monitor and track your own brand and competitor performance.
Fashion industry benchmarking needs to reflect the ongoing changes in the market. Fashion weeks, campaign launches and ambassadorships all create visible spikes in brand performance. But tracking brand performance through quieter periods shows whether this is translating into brand value, or fading once the moment passes.
Positioning itself is also shifting. Premiumization is pushing fashion and sportswear brands to reconsider where they sit within an evolving competitor set. Metrics like Share of Value and MIV evolution show where a brand’s visibility is strongest or most challenged, while a brand’s impact is strongest or most challenging, while Voice Mix and Channel Mix benchmarks reveal the strategies behind a competitor’s performance. For a deeper view, Brand Focus breaks this down further, from top placements to key Voices and MIV evolution.
Beauty industry benchmarks only work when they reflect the way the category moves. A make up launch, a skincare education push and an always-on creator program shouldn’t be judged on the same baseline, because each one is built to create a different kind of visibility. For multi-brand groups, the same logic applies internally too: each brand needs to be benchmarked against the role it plays in the portfolio.
For beauty brands, the useful question is not simply whether performance went up or down. It is what drove the movement: Voices, product interest, launch timing or a wider shift in the category. Once that is clear, benchmarks become easier to use.
Read more in our competitive benchmarking guide for beauty brands >

By Pawandeep Kaur