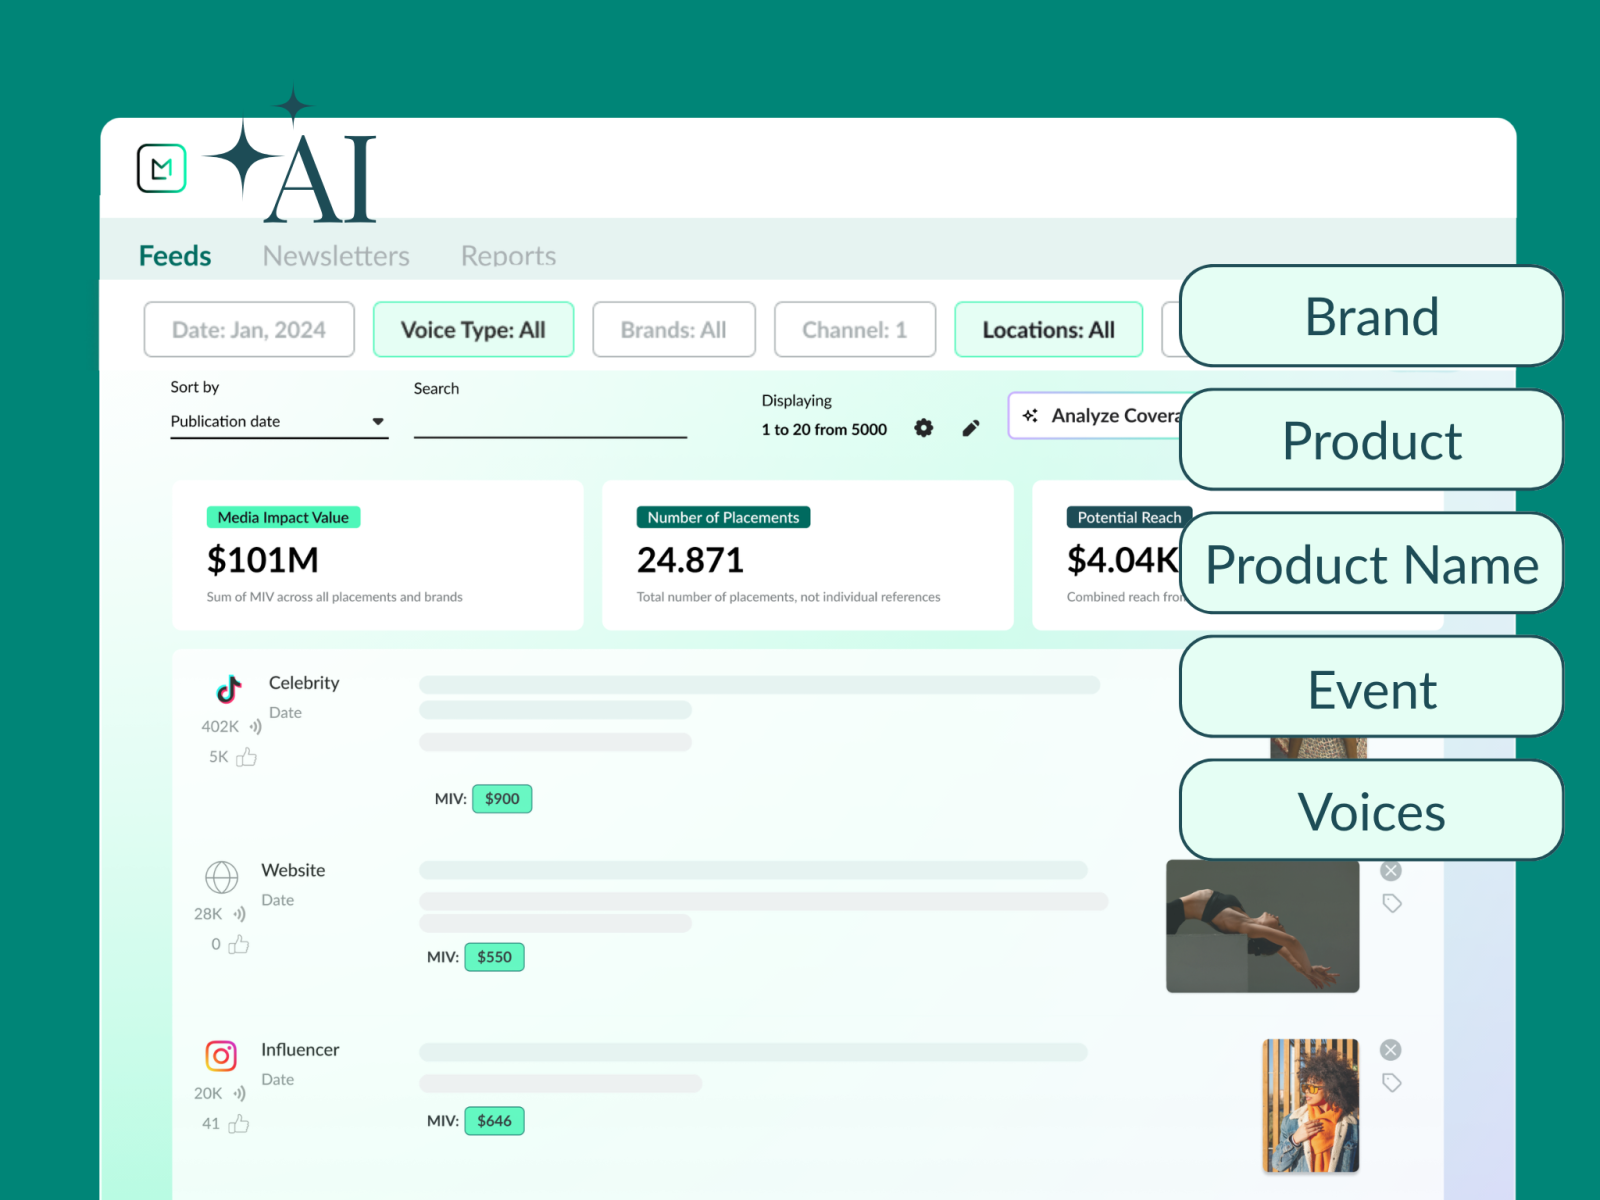
Our metrics solution has always made it intuitive for marketing, PR and communications teams to monitor, filter and measure their coverage. But reporting on that data correctly and making the insights land often require a structured view that can be shared across teams, reused over time and adapted for different stakeholders.
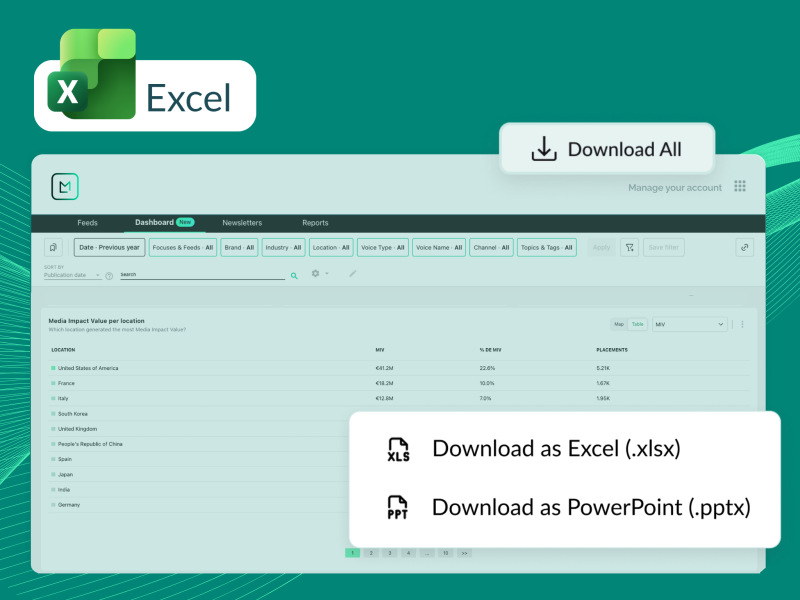
That’s exactly what the Advanced Excel Report is designed for. Built directly into our dashboards, it transforms your filtered feed data into structured, pivot table style reports that can be saved, shared and exported in just a few clicks.
Whether you’re preparing executive updates, campaign reports or recurring brand performance reporting, it gives your team a consistent way to analyze and present brand performance the right way. Read on to learn more about how it works.
What is the Advanced Excel Report?
The Advanced Excel Report is a pivot-table-style report builder built directly into our dashboards. It transforms your filtered feeds into structured, aggregated reports that can be saved, shared and exported in just a few clicks.
Rather than recreating the same report every week or month, you’re able to define the structure once. So whether it’s campaign wrap-ups, recurring brand performance reviews or executive presentations, every report follows the same framework, while the data powering the report updates automatically.
The result is consistent reporting that ensures every market, campaign and team measures performance using the same structure.
How Advanced Excel Works
It’s all about giving your feeds and dashboards the right context. Simply start by filtering your feed to define the criteria you’re looking to report on. For instance, a product launch within a new region, a sample piece loaned to an ambassador during the red carpet or your investment into a new Voice type—whether that’s Traditional Media, Influencers, Celebrities, Partners and Owned Media. Once you’ve applied your filters—or saved them as a feed or focus—there’s no need to recreate your analysis. Whatever you can see in your feed, you’ll be able to report on immediately.

From there, you can build your report by selecting between numerous dimensions and metrics. Our reporting feature makes it easy to group coverage by dimensions such as Voice, Channel, Country, Media Name, Brand or Topic, then measure performance using metrics including Media Impact Value® (MIV®), Placements and Potential Reach.
As you add dimensions, totals and subtotals are calculated automatically, giving you a clear view of performance across categories.
You can then sort and rank your results to surface your highest-performing brands, publishers or campaigns with a single click.
Compare Performance Over Time
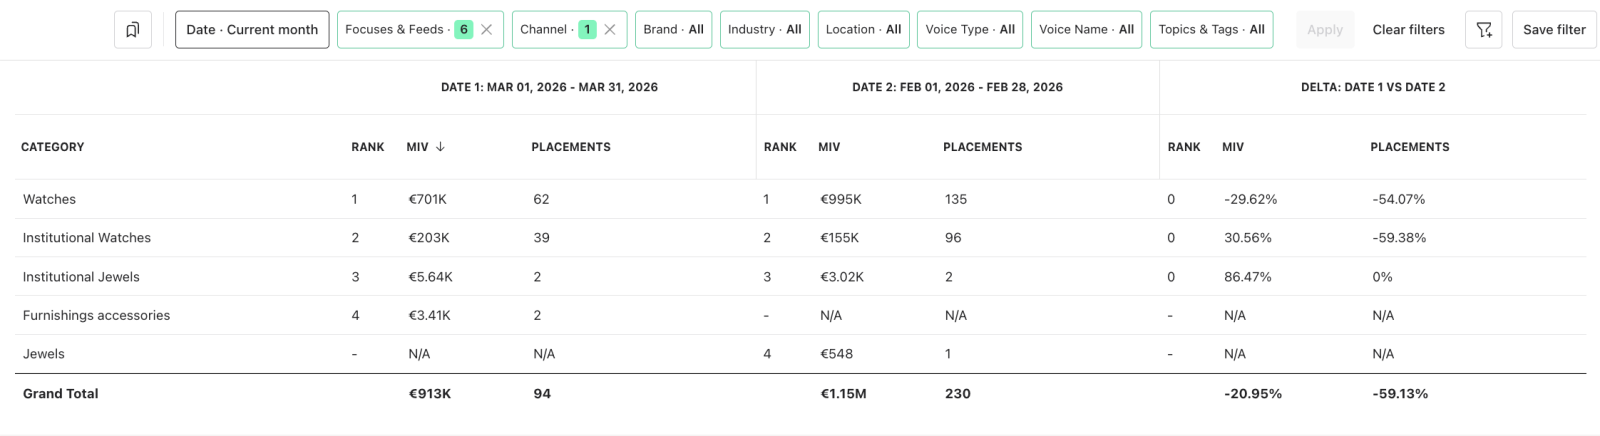
Simply select a second date range and use “Show Delta” to automatically calculate both the percentage and numerical changes between periods. If you’re looking to show how performance changed over time, this report function makes it easy to compare month over month, quarter over quarter or year over year performance.
Keep It for Yourself or Share With Your Team
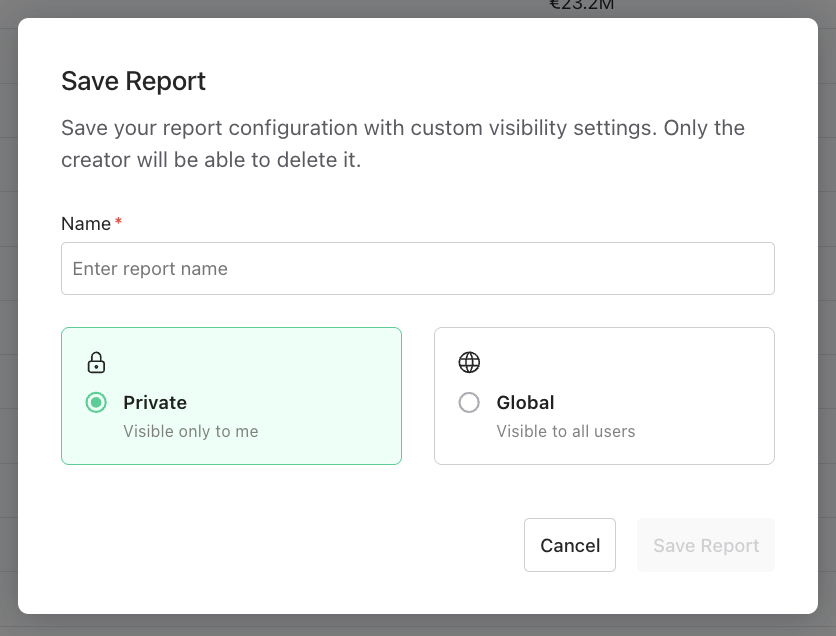
If you want to check how your report will look before exporting, use Preview Report to validate the structure. Once you’re happy with it, save it as Private for your own use or Global to make it available across your team. From then on, there’s no need to rebuild the report each time. Simply update the data by adjusting your feed filters or date range, then export to Excel with a single click whenever you need the latest results.
Use Case: How a Global Communications Director Brings Regions Together
A Global Communications Director is responsible for presenting quarterly brand performance to the executive leadership team. Regional teams across Europe, North America and APAC all contribute to the report, but without a standardized structure, every market appears to present its data differently, making comparisons difficult, time-consuming and inconsistent.
He creates a report grouped by Market and Channel, with MIV and Placements as the core metrics. Following this, he adds the previous quarter as a comparison period, enables Show Delta and saves the report as Global.
Now, each regional team uses the same report template when analyzing their local coverage. Rather than reformatting data, all they need to do is update their filters and export the latest results. With every region reporting against the same structure, the Global Communications Director can now bring those reports together quickly, compare performance across markets with confidence and deliver a consistent view of global brand performance to leadership.
Ready to Standardize Your Reporting?
Book a demo to see how the Advanced Excel Report can save your team time in building reports and act faster for a reliable reporting cycle. If you’re already a Launchmetrics customer, reach out to your Customer Success Manager to get started.

Standardize How Your Team Report on Brand Performance
See how our metrics solution brings insights together for consistent reporting.

By Pawandeep Kaur