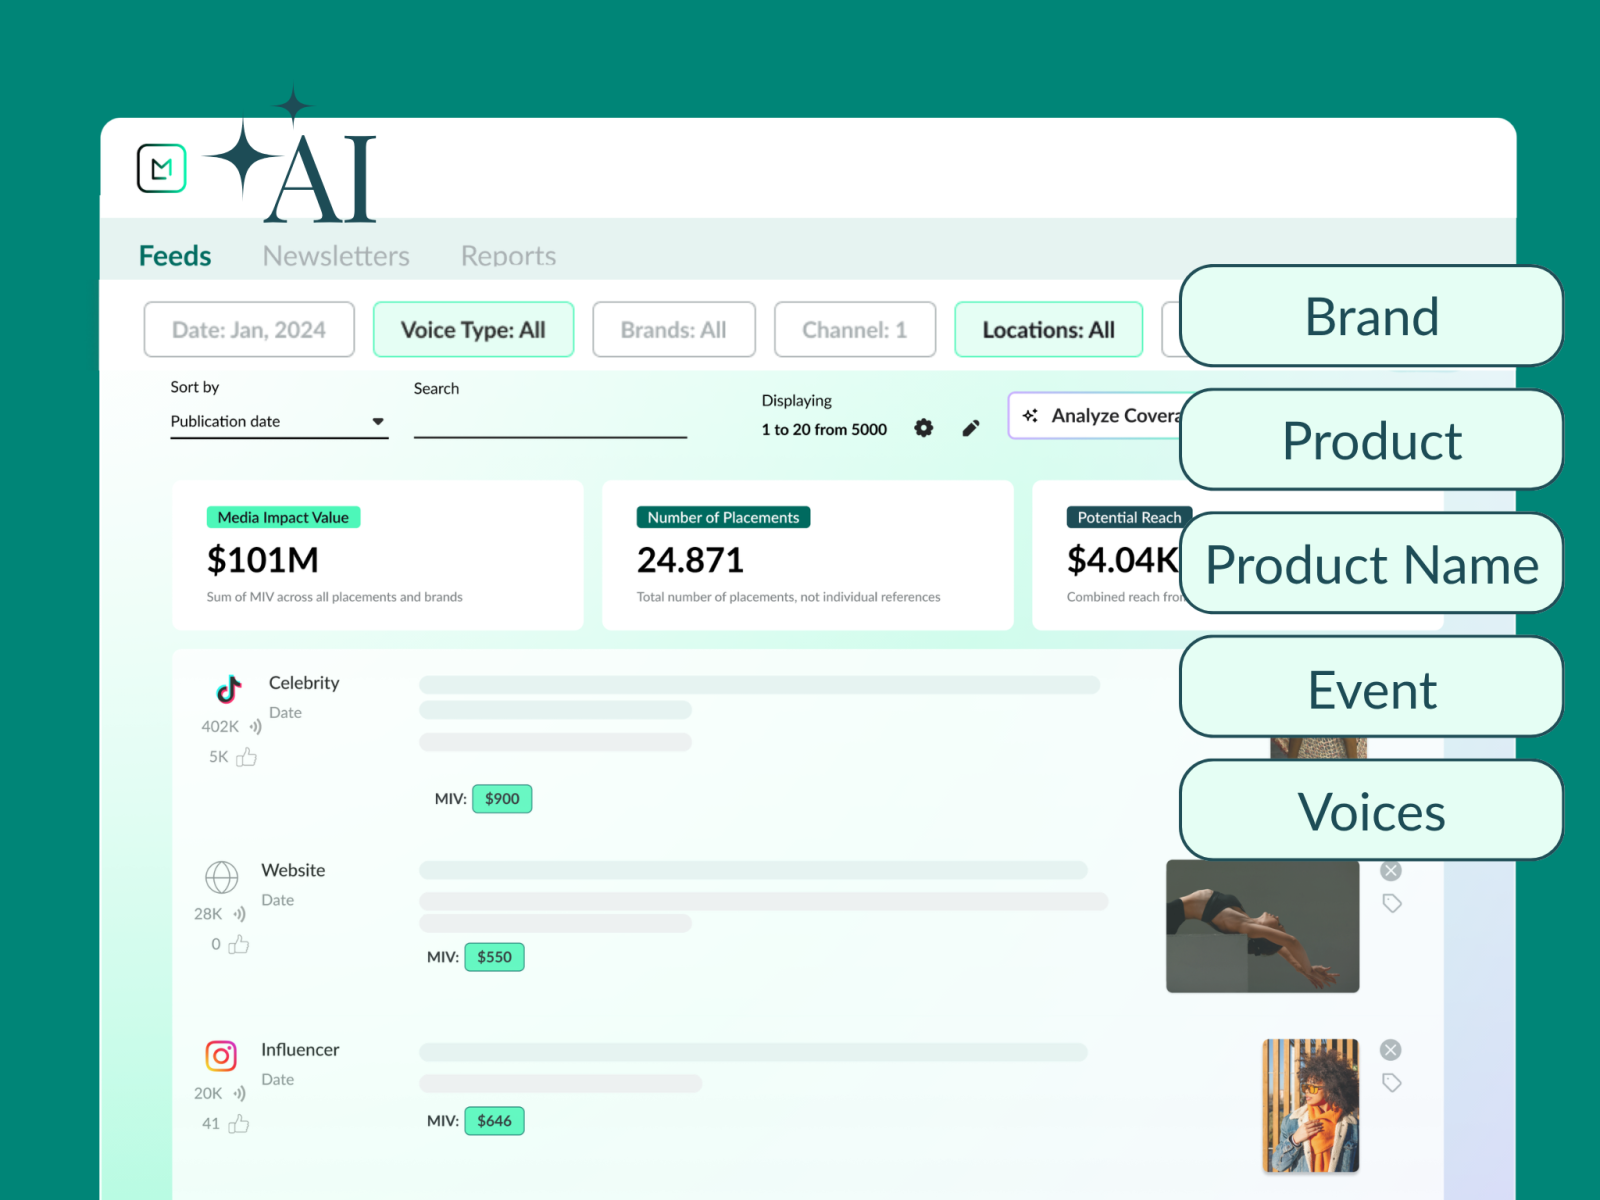
Launchmetrics’ media monitoring solution has always been the central place where Fashion, Lifestyle and Beauty (FLB) brands monitor, filter and measure the Media Impact Value® (MIV®) of their global print, online and social media coverage.
But monitoring coverage and understanding the story behind it are two different things. Until now, moving from a stream of individual placements to a clear view of campaign performance often meant switching to a reporting view or building a report.
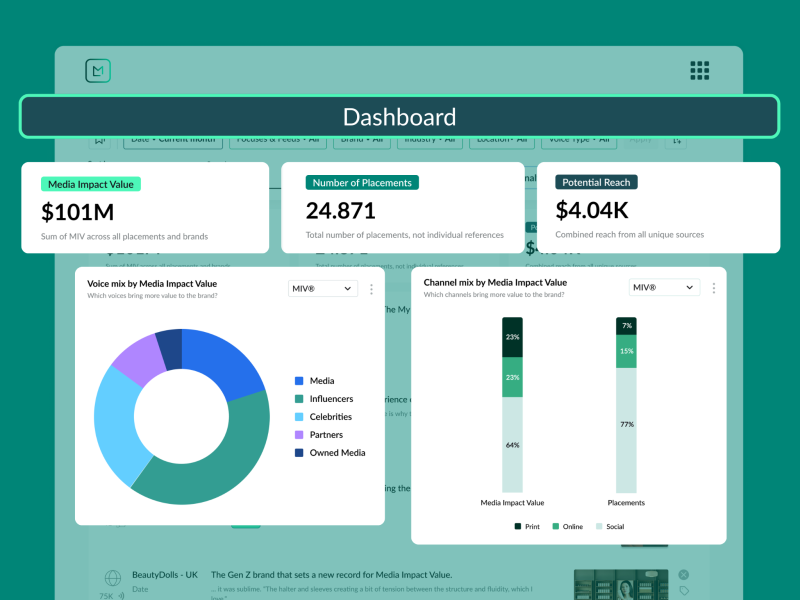
Today, we’re introducing Dashboards: a visual analysis layer built directly alongside your feed. Instead of analyzing placements one by one, you can instantly visualize the performance of your filtered coverage, to identify trends, understand what’s driving impact and share insights without leaving your feed entirely.
Read on to explore the insights Dashboards unlock and how you can use them daily.
What are Dashboards?
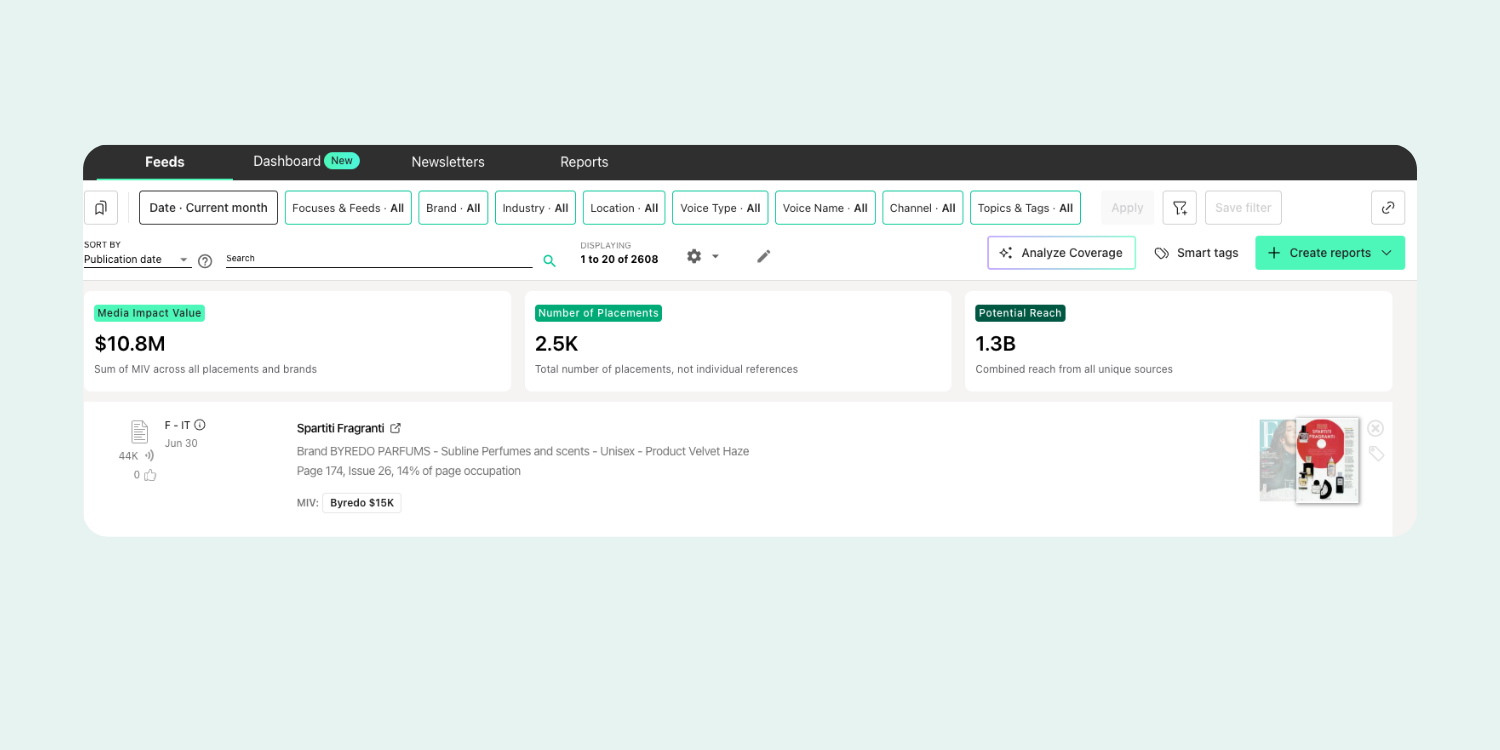
Dashboards transform your filtered Feed into an interactive performance overview.
Rather than reviewing placements one by one, you can instantly see how your coverage is performing across key metrics, identify what’s driving results and export presentation-ready visuals for easy reporting.
Whether you need to identify which Voices drove the most impact during a specific moment, pinpoint when a story peaked or pull together results for a stakeholder presentation, Dashboards give you the visual layer to do it without slowing down your workflow.
How do Dashboards Work?
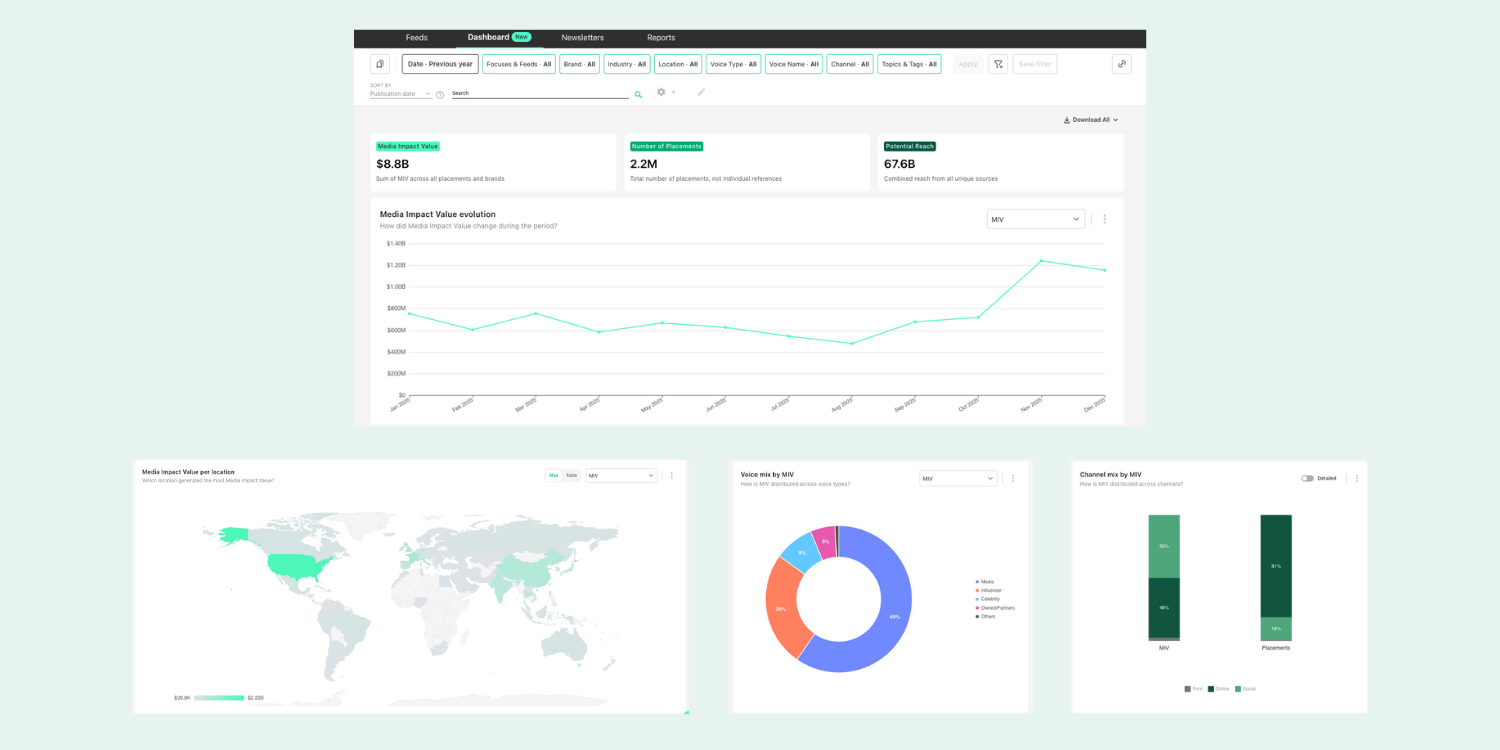
Dashboards work with the filters and tags you’re already using in your feed. These can include campaign, brand, market, tags or date range filters which automatically update your Dashboard every time you change your criteria.
Your dashboard includes:
- Performance Overview: Total MIV, placements and Potential Reach
- Performance Over Time: MIV evolution
- World Map: Geographic distribution of coverage
- Top Contributors: Up to top 30 Voices and placements by MIV
- Channel Mix with simplified and detailed views
When you’re ready to share your findings, export the full dashboard as PowerPoint or Excel, or download individual chart images. This presentation-ready reporting saves your team the time of building a report from scratch.
Three Ways Teams are Using Dashboards
Dashboards can be used in a range of scenarios—whether you need to quickly identify which Voices drove the most impact for a specific moment or when you’re trying to pinpoint exactly when a story peaked. For teams that regularly report on media performance, having that visual layer immediately available changes the pace of analysis into actionable insights.
1. Post-Fashion Week Coverage Wrap-Up
A luxury fashion brand has just closed out New York Fashion Week and the communications team has tracked thousands of its placements across all channels throughout the week. Senior stakeholders now want to understand the global scale of their coverage and which Voices amplified the collection beyond the runway.
Using the Dashboard, the team discovers that their strongest momentum outside the U.S. came from APAC, driven by Celebrity front row attendees whose posts continued generating impact days after the show ended.
The data tells a clear story: while their New York show made the news, the right Celebrities made it travel. These findings can instantly be exported as a presentation to give leadership a data-backed view of what drove global visibility and where to focus investment next season.
2. Understanding Who Drove Performance: Launching a New Beauty Collection
A beauty brand has partnered with a celebrity ambassador to launch a new skincare range. The campaign performs well in MIV, but the team lead wants to understand what drove the buzz and sustained momentum beyond launch day before planning their next activation.
After filtering the feed to the campaign period, the Dashboard maps how MIV evolved across the campaign window with a Voice Echo effect—when coverage extends beyond the Voice itself. While the ambassador’s own announcement generated the biggest spike in MIV, Influencer and Media coverage continued to speak about collaboration in the days that followed. With a clear view of how the campaign evolved, the team can confidently plan the length of their next launch around the Voices and partnerships that delivered the greatest impact.
3. Identifying Peak Moments: Understanding What Drove Red Carpet Visibility
A fashion brand dresses several guests for the Met Gala and unsurprisingly, sees a significant spike in MIV during the event. Rather than stopping at the headline MIV number, the communications team wants to understand exactly which celebrity drove a majority of the impact.
They quickly identify when coverage peaked and explore the placements and Voices behind those moments. They find that the biggest surge came after two particular celebrities who shared their looks on social media, followed by coverage from leading fashion publications. The insight helps the team better plan the timing of content and outreach for next year’s event.
Get to Know the Value of Your Feed
Whether you’re preparing for your next campaign or have a big event coming up, Dashboards are readily available in Launchmetrics. Book a demo now to bring visual performance analysis directly into your media monitoring workflow—or if you’re an existing customer, contact your Customer Success Manager to learn more.

See Dashboards in Action
Our experts can take you through a personalized experience of our media monitoring solution.

By Pawandeep Kaur