
With the rise of digitalization, consumers of today have been shifting towards purchasing online and connecting through social networks like Instagram and TikTok. As a result, Fashion, Luxury, and Beauty (FLB) brands are shifting their strategies to stay aligned and relevant, but also focusing more of their efforts on ROI and improving brand efficiency. Thus, many brands are thinking about how they can build smarter initiatives with smaller budgets, which makes it a good time to consider competitive benchmark metrics.
What is Competitive Benchmarking?
Competitive benchmarking is the comparison of your brand against a number of competitors using specific metrics. This is used to measure your brand’s performance and compare it against competitors over time. First, dig into your competitors’ strategies to leverage and identify their key differentiators. From there, start to analyze your brand’s performance and review your channels and Voices that yield the best results. This will help you understand and see where you should plan your strategies.
But how do you really review, analyze, and benchmark? What are the ways to make your process more streamlined and still compare against your competitors?
At Launchmetrics, we review industry rankings using 3 key performance metrics that are tailored to fashion, luxury, and beauty that will help you uncover powerful insights against competitors. These metrics can be found on the Insights Analytics Dashboard, which allows you to see your brand’s overall performance within your industry.
What specific industry does your brand fall under?
Launchmetrics has created an FLB industry index, which is a method to track the performance of a group of brands in a standardized way. The index is based on a brand’s market positioning and product categories. The 8 different industry groupings are Luxury Fashion, Premium Fashion, Mass-Market Fashion, Luxury Beauty, Premium Beauty, Mass-Market Beauty, Watches & Jewelry, and Retailers.

By organizing FLB brands into these different industries, it makes it easier to identify relevant competitors using the 3 key competitive benchmark metrics, starting with Media Impact Value™ Evolution.
-
Media Impact Value™ Evolution
Before we talk about its evolution, What is Media Impact Value™?
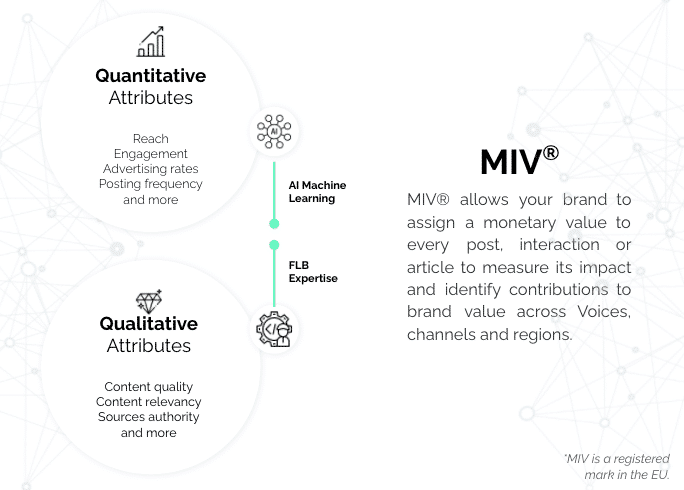
Media Impact Value™ (MIV®) allows your brand to benchmark all marketing and communication initiatives under one single industry measurement standard that has been recognized by The New York Times, Le Monde, Vogue, WWD, and Forbes to name a few. MIV® is made up of Quantitative and Qualitative attributes and relies on AI Machine Learning.
Now, how does the evolution of MIV® act as one of the competitive benchmark metrics?
With a single measurement standard, MIV® becomes a benchmark value, making it easy to compare your brand against your competitors over time. On the Industry Analysis Dashboard, the year on year (YoY) MIV® evolution indicates exactly how your brand and your industry has changed over the past year.
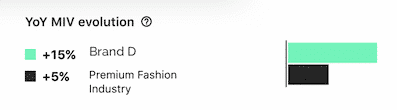
For example, Brand D has a YoY MIV® evolution of +15% and Brand D is part of the Premium Fashion Industry. The Premium Fashion Industry shows a YoY MIV® change of +5%, which is calculated by taking the median of the evolutions/changes of all individual brands in this industry. Thus, the MIV® evolution indicates that Brand D is performing above the industry average when it comes to MIV®. This comparison puts your brand into a wider industry perspective. Let’s say your brand decreases by 2%, but your industry decreases by 15%. Looking at MIV® evolution could show that your brand is actually performing pretty well. All performance should always be analyzed with relativity.
Don’t forget that the MIV® evolution can be filtered at any time by date, Voice type, and channels. The date is self-explanatory, but what does Voice type mean?
At Launchmetrics, we have created our unique Voice-centric approach that allows you to understand how your marketing mix is evolving in time and how it performs against competitors. Instead of using a media-specific approach (Paid, Owned, and Earned Media), we approach marketing activities by the Voices that influence the customer buying journey. This is broken down into our 5 Voices:
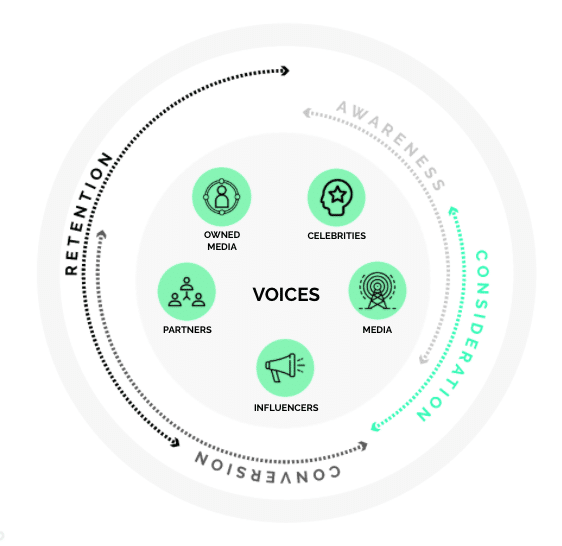
By filtering to the Voice, you will be able to see the shift in MIV® as it will show the evolution related to one of your 5 Voices.
Overall, YoY MIV® evolution is a competitive benchmark metric to see how your brand performed against your industry over the past year. Let’s see what other metrics we can use when comparing to other brands.
2. Where you are ranked with your Industry
Now, the YoY MIV® evolution shows you if your brand performance is aligned with the trends of your market and helps you better assess your brand. However, your exact ranking shows exactly where you are placed in the industry, whether that is in the top 10%, 25% or 50%, or the bottom 10%, 25% or 50%.
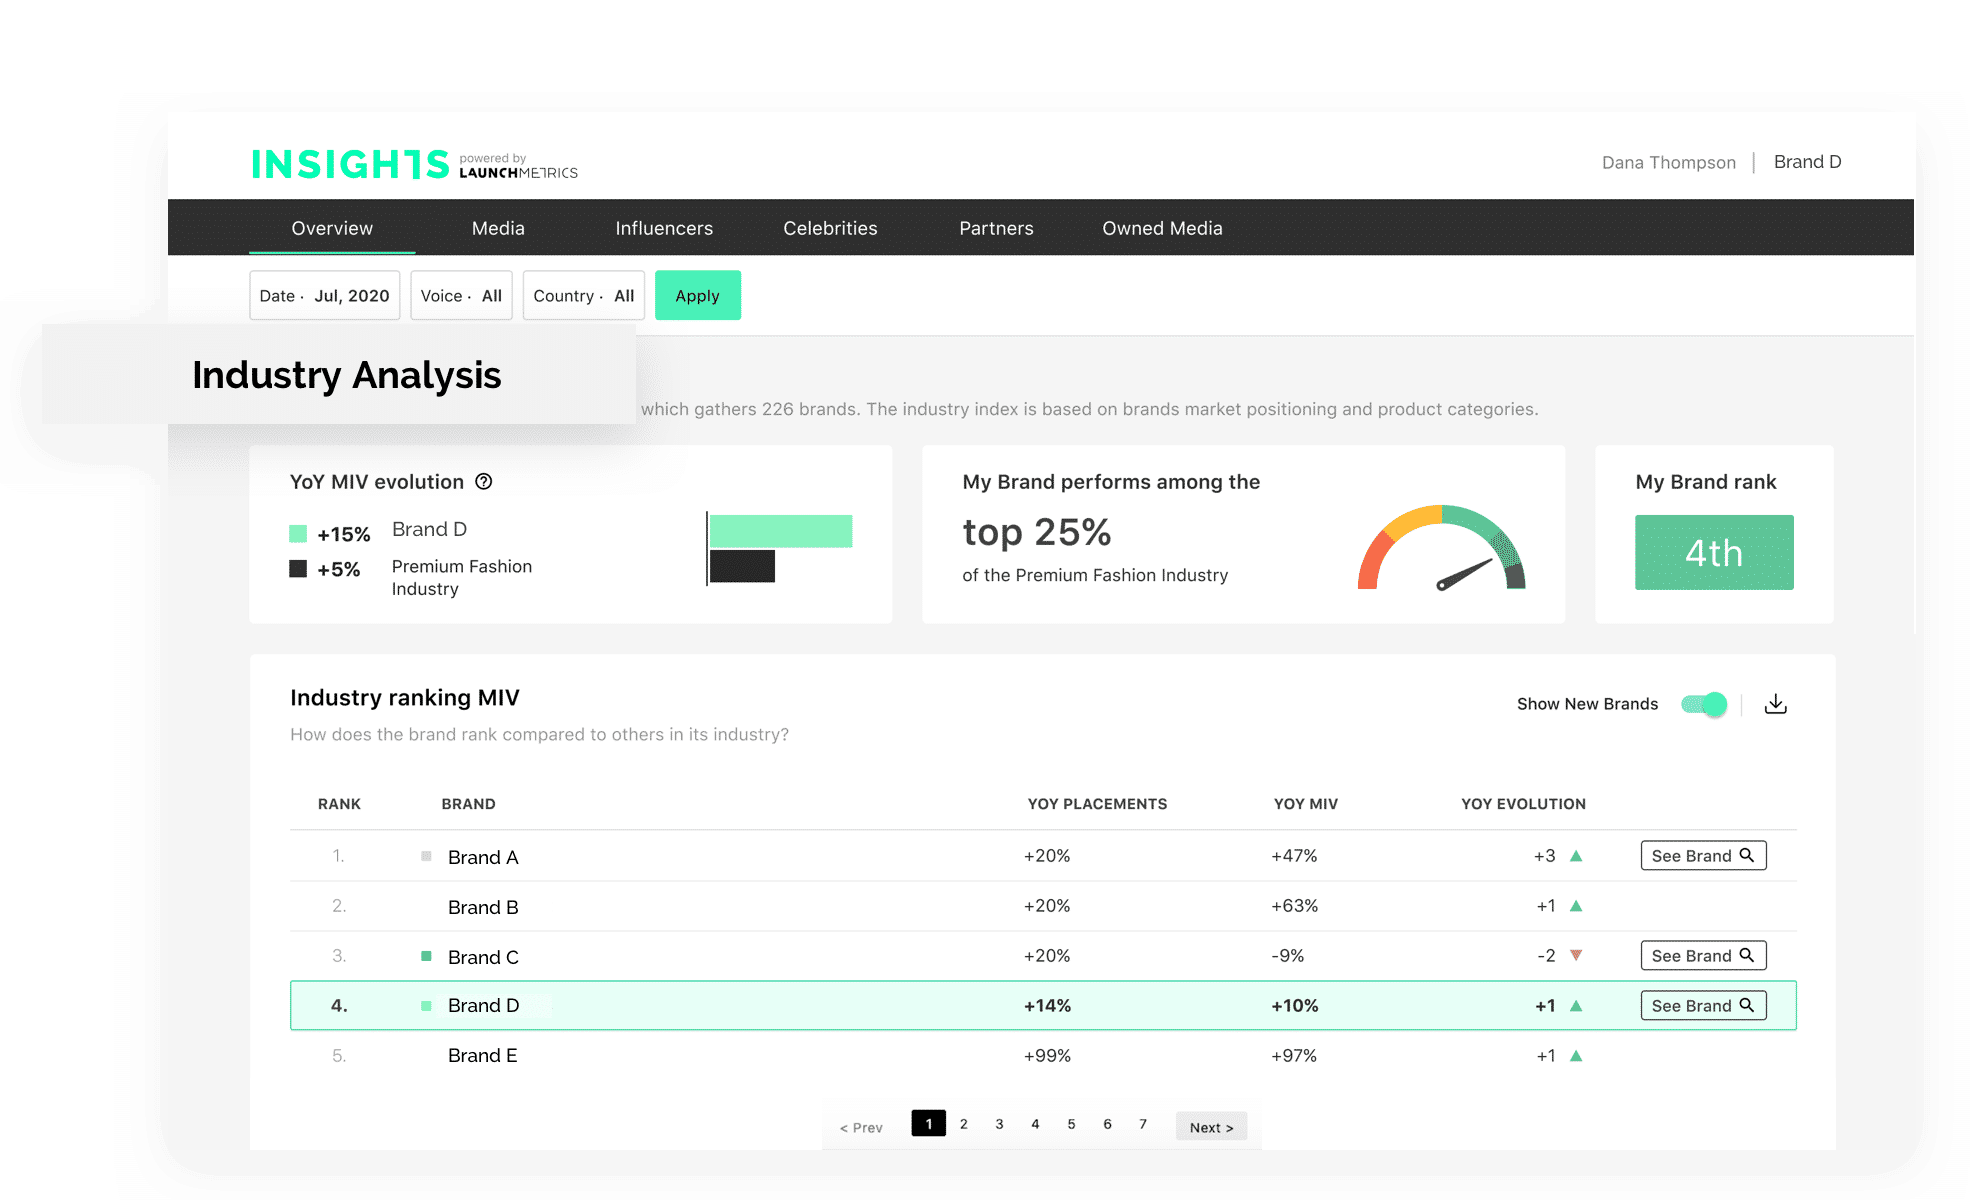
In this example, Brand D is performing among the top 25% of the Premium Fashion Industry and is ranked 4th overall. Within the Industry Analysis Dashboard, the brand ranking range and placement can change when the date, Voice type, and country are filtered. And thus, your brand ranking indicates your exact placement (1st, 2nd, 3rd..etc) and ranking range against others within your industry, but the last and third metric will really show the details and why that is.
3. The evolution of industry ranking based on MIV®
Lastly, the Industry Ranking list shows all of the brands in your specific industry by MIV®. The ranking indicates the YoY placements, YoY MIV®, and the overall YoY evolution. Thus, you are able to see how your brand's industry ranking has changed over time. The date filter can come in handy as well. On the Industry Analysis Dashboard, you are able to detect new competitors that you can analyze in more detail.
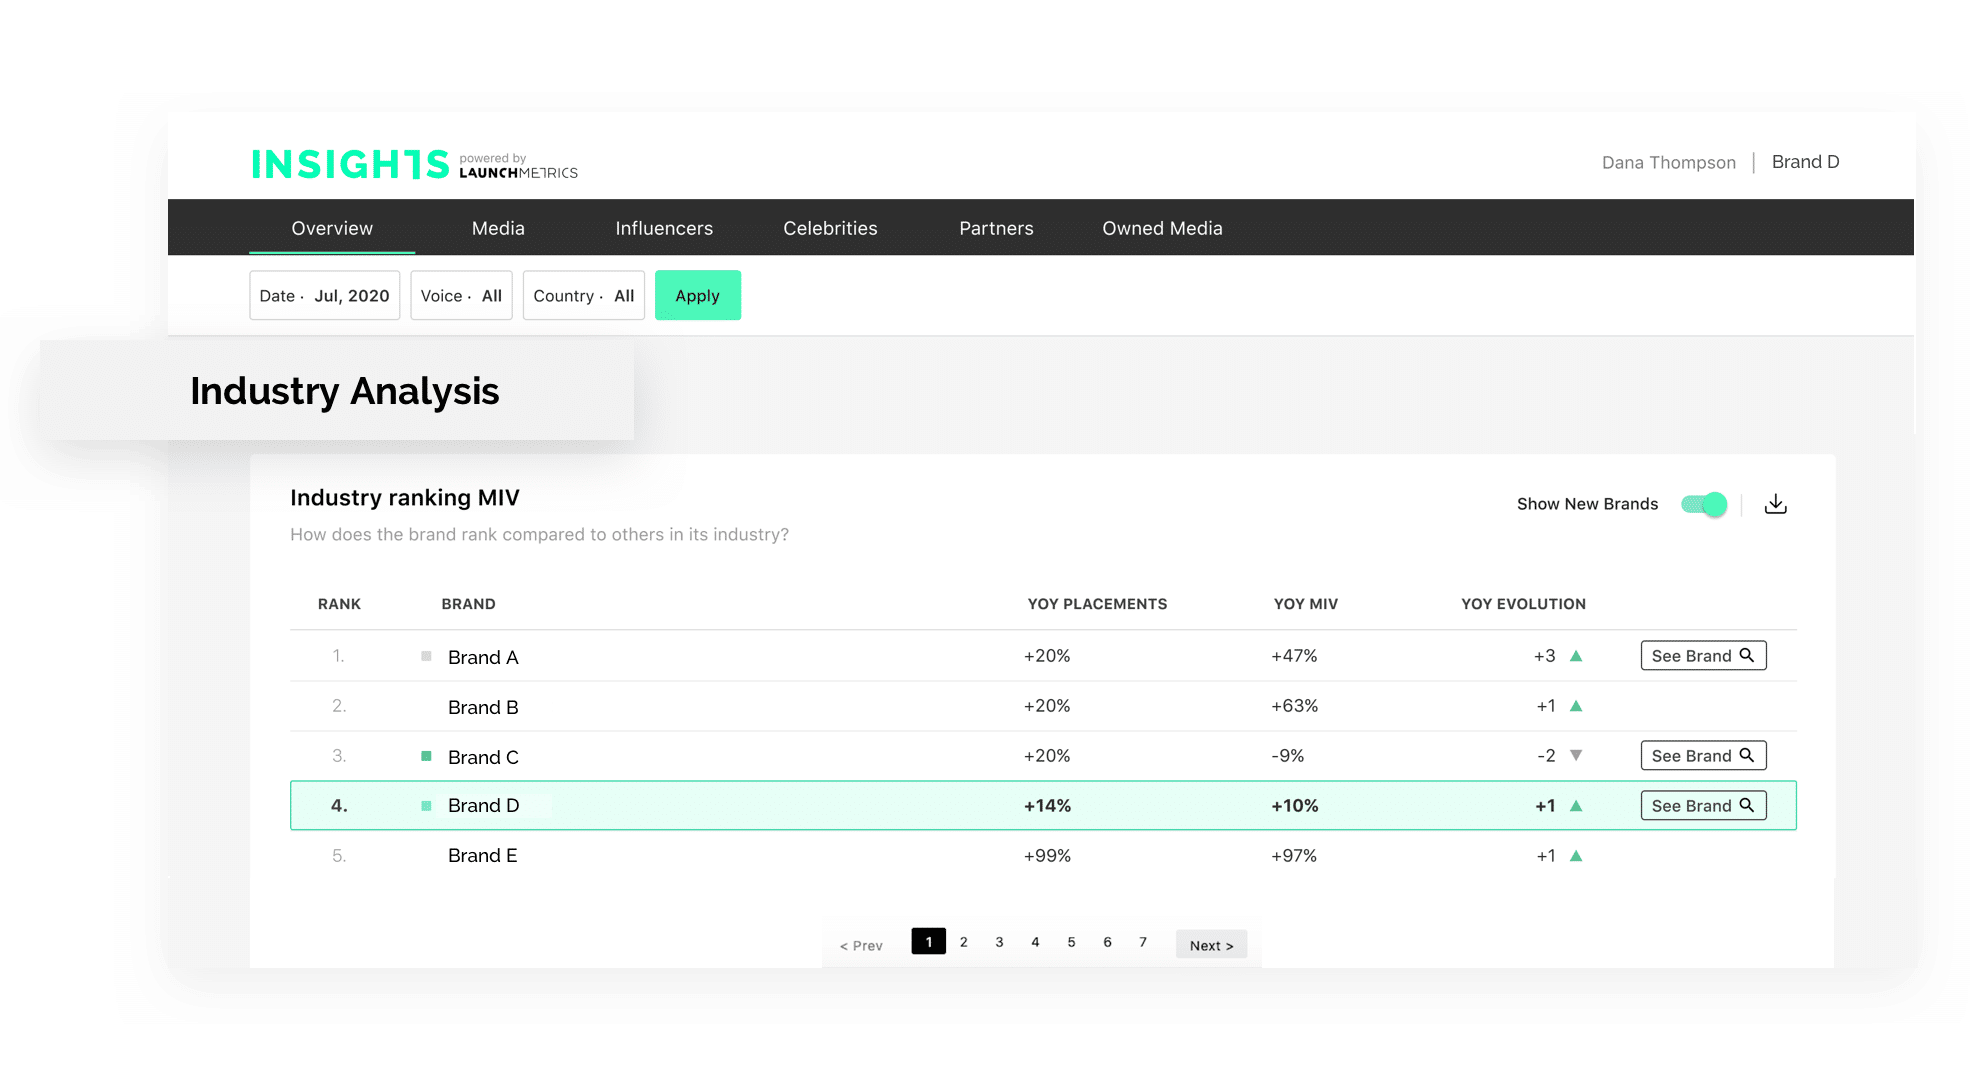
The Industry Ranking gives you a better understanding of why your brand is ranking, whether that is 4th or 1st, and how it has evolved over the past year. Ultimately, it really allows you to see directly where you stand against your competitors and is a key performance metric to keep in mind.
So when you are thinking about competitive benchmarking, don’t forget to consider the following key performance metrics: your brand’s MIV® evolution, where your brand is ranked and the evolution of industry ranking based on MIV®.
All of these detailed metrics can be found in the Industry Analysis Dashboard, which benchmarks hundreds of brands across Fashion, Luxury, and Beauty. The number of brands in our industry analysis is constantly growing. Overall, the Industry Analysis Dashboard helps you understand your brand’s position on a macro level, track the industry evolution, and discover any newcomers or potential competitors too.
Why not check out our Insights application, where you can discover where your brand is ranked and positioned using the 3 competitive benchmark metrics?

![]()
By Gina GulbertiVICE PRESIDENT OF MARKETING
Gina is passionate about storytelling, creativity, and digital strategies. As Vice President of Marketing, she leads a rockstars team from the sunny city of Madrid! Being a crazy savvy marketer, in 2020 Gina co-founded the global community of b2bmarketers.com and currently combines all this activity, teaching Inbound Marketing in different business schools.
![]()
![]()
![]()